Log in
Email
Password
Register
Menu
Explore
Newest photos
Popular photos
Contribute
Submission guidelines
Photographer signup
Photographer login
About
About Freerange
Image license
API
Contact us
Support
Contact support
FAQ
Login
Login
Register
Search all
Photos
Illustrations
Match All
Match Photo ID
Newest
Popular
Select Category
AI Generated
CC0 Images
Editorial and News
Animals & Insects
Architecture
Architectural Details
Arts & Music
Backgrounds & Textures
Cities and Modern Life
Business & Office
Flowers and Plants
France
Food & Drink
Holidays & Occasions
Health and Fitness
Landmarks
Interiors
Illustrations
Industry & Agriculture
Landscapes & Nature
Letters and Numbers
Objects
Other
Military
People
Signs & Symbols
Sky and Clouds
Space
Sports & Recreation
Technology
Wallpapers
Free Stock Images
Sponsored images from iStock
View footage results
Click to save 15% sitewide with code
FREERANGE15
View More
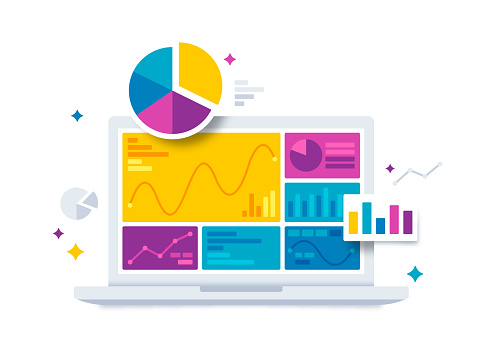
101 free data charts photos from Freerange
Filter results
Popular
Most Viewed
Newest Photos
All licenses
Freerange
CC0
Photos & Illustrations
Photos
Illustrations
Per Page
25
50
100
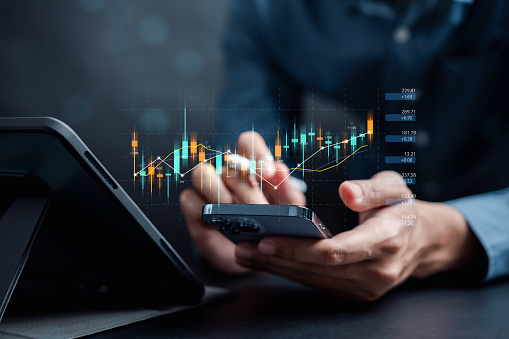
Online Payments - SaaS - Mobile Payments Technology
Online Payments - SaaS - Mobile Payments Technology
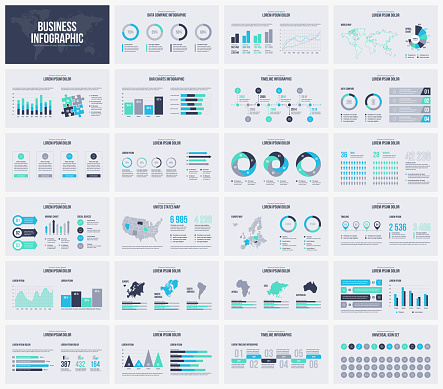
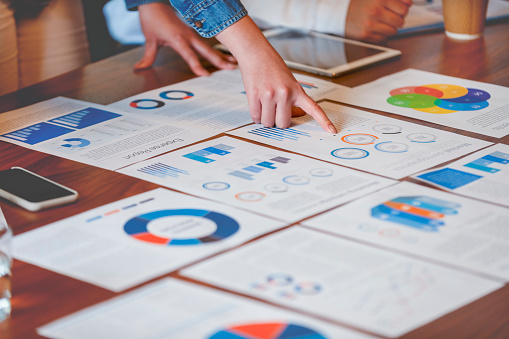
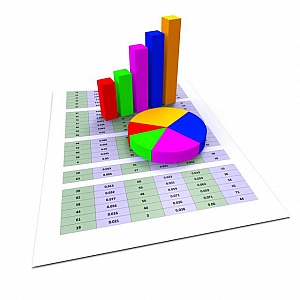
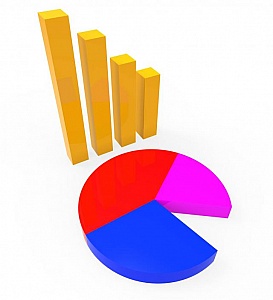
Graph Report Represents Information Corporation And Graphic
Graph Report Meaning Business Analysis And Infograph
Abstract Pattern - Network - Arrows - Blockchain
Abstract Pattern - Network - Arrows - Blockchain
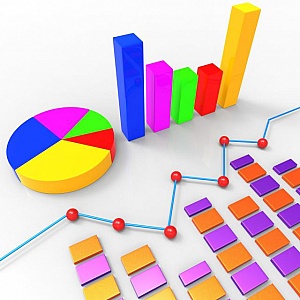
Graph Report Means Trend Financial And Profit
Graph Report Representing Commerce Finance And Trading
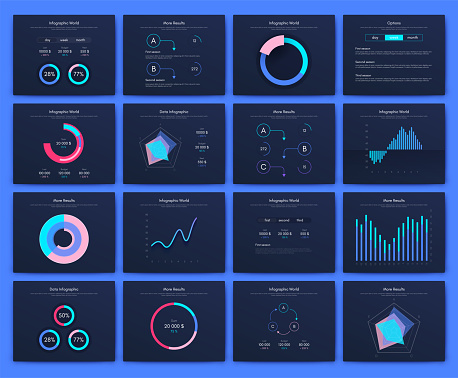
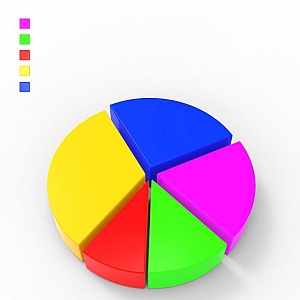
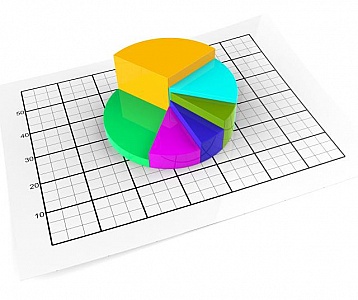
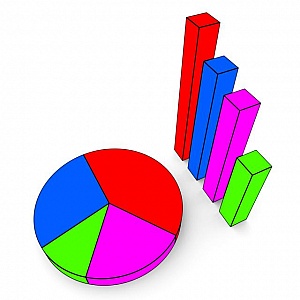
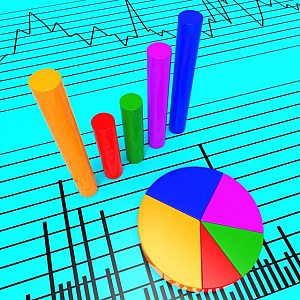
Pie Chart Indicates Business Graph And Charts
Pie Chart Showing Progress Report And Graphs
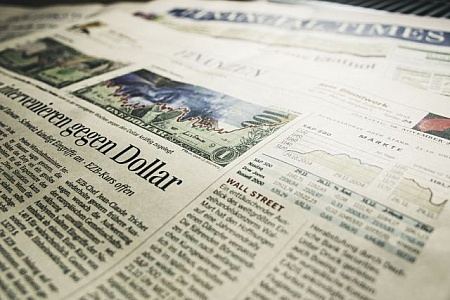
Close-up of a newspaper with financial charts
An array of financial news and charts displayed on a newspaper, showcasing market trends and economic insights
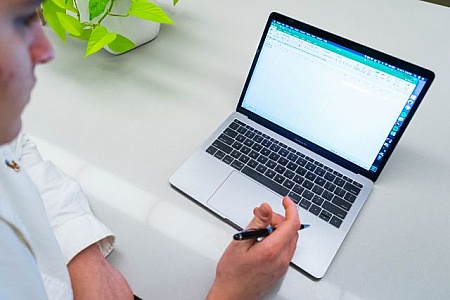
Laptop displaying spreadsheet on white table
An individual analyzes data on a laptop screen, which displays a spreadsheet in a clean, well-lit office environment
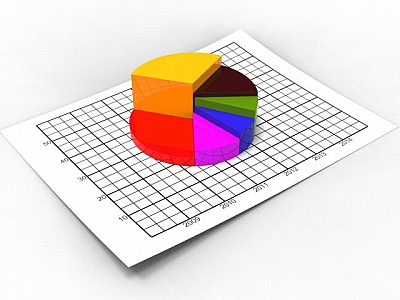
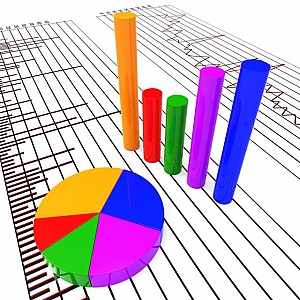
Pie Chart Shows Business Graph And Biz
Pie Chart Representing Business Graph And Diagram
Pie Chart Indicates Financial Report And Charts
Pie Chart Showing Business Graph And Graphic
Pie Chart Shows Business Graph And Charting
Pie Chart Representing Business Graph And Statistical
Pie Chart Indicates Forecast Statistics And Figures
Pie Chart Showing Business Graph And Graphic
Digital Connections Concept
Digital Connections Concept
DNA - Genetic Sequencing Concept - Red Queen
DNA - Genetic Sequencing Concept - Red Queen
Online Payments - Online Payments Technology
Online Payments - Online Payments Technology
Pie Chart Indicates Stat Graphics And Infochart
Pie Chart Meaning Business Graph And Forecast
Pie Chart Shows Business Graph And Charting
Pie Chart Indicating Business Graph And Charts
Graph Report Represents Trend Graphics And Finance
Graph Report Indicating Trend Analysis And Biz
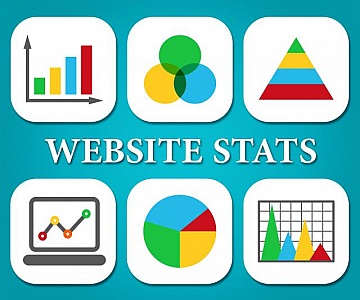
Website Stats Means Business Graph And Analysis
Website Stats Indicating Business Graph And Report
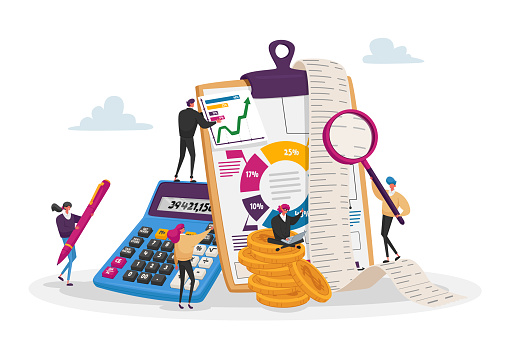
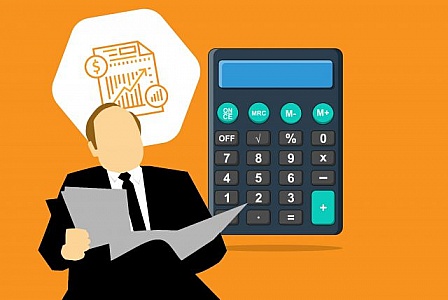
accounting department
Illustration of accounting process with accountant and calculator.
Block Chain Network Transactions - Distributed Ledger Technology - Digital Chains
Block Chain Network - Distributed Ledger Technology - Digital Chain Transactions - Cryptocurrency
Block Chain Network - Distributed Ledger Technology - Digital Chains
Block Chain Network - Distributed Ledger Technology - Digital Chains
Online Payments - Mobile Payments Technology
Online Payments - Mobile Payments Technology
Secure Online Payments - Online Payments Security
Secure Online Payments - Online Payments Security
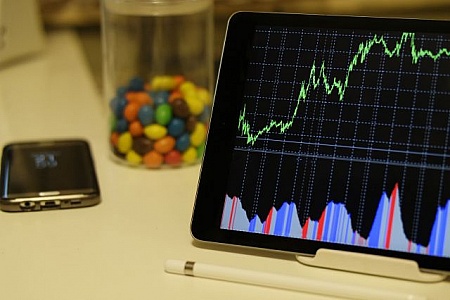
Tablet displaying stock market data next to candy
An electronic tablet with a colorful display of the stock market charts, indicating financial analysis with candy jar blurred in the background
Pie Chart Shows Business Graph And Graphic
Pie Chart Meaning Business Graph And Statistic
Graph Report Indicates Diagram Charts And Analysis
Graph Report Meaning Infograph Commercial And Profit
Abstract - Dynamic Arrows - Technology - Finance - Fintech - Blo
Abstract - Dynamic Arrows - Technology - Finance - Fintech - Blockchain - Copyspace
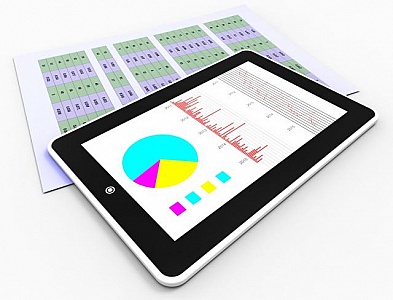
Online Reports Represents Business Graph And Analysis
Online Reports Meaning Tablet Pc And Infograph
Calculate Statistics Shows Calculated Data And Statistical
Calculate Statistics Representing Chart Computes And Calculates
Calculate Statistics Means Charting Figures And Calculator
Calculate Statistics Showing Data Computes And Figures
Artificial Intelligence - Human-Machine Interface - With Copyspa
Artificial Intelligence - Human-Machine Interface - With Copyspace
Graph Report Means Trend Graphs And Graphic
Graph Report Showing Statistical Information And Statistics
Graph Report Shows Statistic Statistics And Infochart
Graph Report Meaning Data Investment And Analysis
Pie Chart Shows Business Graph And Charting
Pie Chart Indicating Business Graph And Statistic
Graph Report Means Finance Data And Information
Graph Report Indicating Profit Data And Statistical
Online Reports Means Tablet Pc And Charting
Online Reports Representing Tablet Pc And Diagram
Statistics Data Indicates Stats Bytes And Reports
Stats Data Representing Statistical Analysis And Facts
Graph Report Shows Graphs Charts And Infochart
Graph Report Representing Financial Corporate And Analysis
Graph Report Indicates Finance Business And Data
Graph Report Showing Statistic Infograph And Trade
Graph Report Shows Trading Forecast And Diagram
Graph Report Meaning Company Trading And Trade
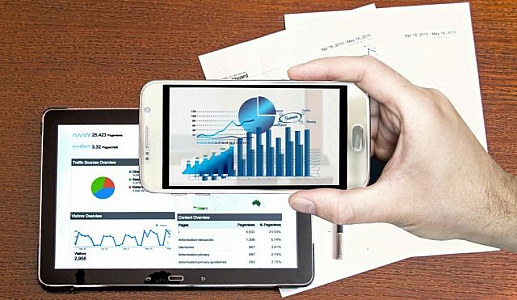
business analysis
Photo illustration of hand holding mobile device displaying business charts and graphs. Analytics and performance.
Graph Report Shows Investment Forecast And Business
Graph Report Representing Graphic Document And Charts
Graph Report Means Finance Data And Information
Graph Report Indicating Profit Data And Statistical
Network - Technology - IT - Communication - Blockchain - Sunrise
Network - Technology - IT - Communication - Blockchain - Sunrise Over the Earth
Graph Report Represents Trade Corporate And Finance
Graph Report Meaning Information Financial And Commercial
Graph Report Represents Data Corporate And Forecast
Graph Report Showing Data Finance And Corporation
Graph Report Means Biz Trade And Diagram
Graph Report Indicating Trend Financial And Infograph
Graph Report Shows Infochart Document And Investment
Graph Report Indicating Commercial Information And Finance
Man reading financial news on newspaper
A well-dressed man holding a business newspaper with visible financial news and charts analytics
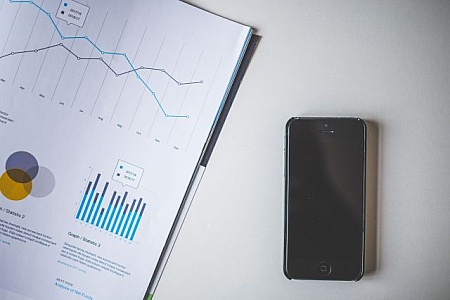
Graph Chart and iPhone
Overhead view of graphic chart document with mobile phone on white table
Find even more royalty free stock photos from the world's best photographers
View
of
3
Try your search on iStock: